
Site map


Site map |
||||
|
|
|
|
|
|
|
|
|
|
|
|
*.lst) and a peak list (file extension
*.par). For the result file, selectplaster.lst and open it:
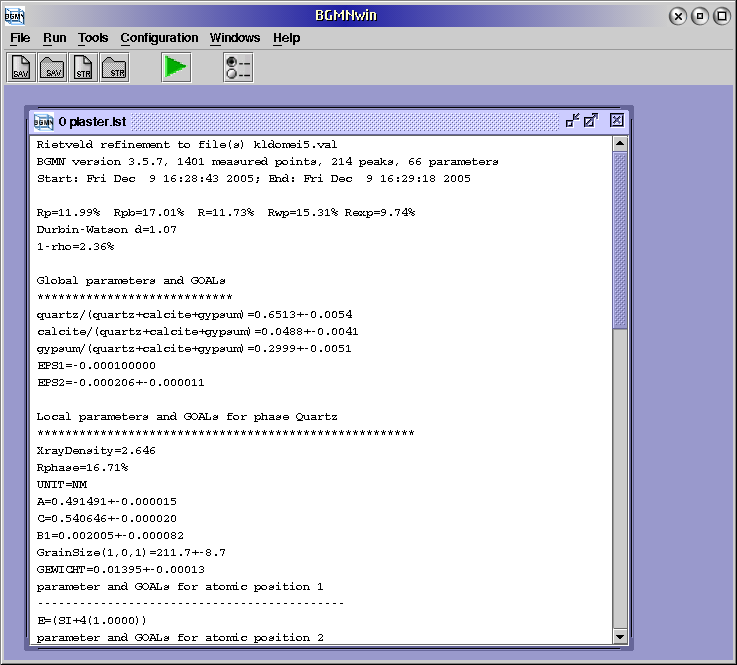
Lets have a look at the result list of the plaster example
(plaster.lst).
The file starts with some information about the calculation, R values etc.:
Rietveld refinement to file(s) kldomei5.val
BGMN version 3.5.7, 1401 measured points, 214 peaks, 66 parameters
Start: Thu Dec  8 18:22:16 2005; End: Thu Dec  8 18:22:50 2005

Rp=11.99%  Rpb=17.01%  R=11.72%  Rwp=15.31% Rexp=9.74%
Durbin-Watson d=1.07
1-rho=2.35%
Then all global parameters and the results of the quantitative analysis are listed:
Global parameters and GOALs
****************************
quartz/(quartz+calcite+gypsum)=0.6513+-0.0054
calcite/(quartz+calcite+gypsum)=0.0488+-0.0041
gypsum/(quartz+calcite+gypsum)=0.2999+-0.0051
EPS1=-0.000100000
EPS2=-0.000206+-0.000011
It can be seen, that the zero point parameter EPS1 (unit radian) was shifted to its lower limit, but this doesn't matter. It is ok because of the strong correlation with the displacement parameter.
Then all phase specific parameters are listed. Its sure that the lattice constants and some information of particle size are useful:
Local parameters and GOALs for phase Quartz
******************************************************
XrayDensity=2.646
Rphase=16.71%
UNIT=NM
A=0.491491+-0.000015
C=0.540646+-0.000020
B1=0.002007+-0.000082
GrainSize(1,0,1)=211.5+-8.7
GEWICHT=0.01395+-0.00013
parameter and GOALs for atomic position 1
--------------------------------------------
E=(SI+4(1.0000))
parameter and GOALs for atomic position 2
--------------------------------------------
E=(O-2(1.0000))

Local parameters and GOALs for phase Calcite
******************************************************
XrayDensity=2.699
Rphase=12.20%
UNIT=NM
A=0.49987+-0.00033
C=1.7074+-0.0013
B1=0.0133+-0.0014
GrainSize(1,0,4)=31.9+-3.4
GEWICHT=SPHAR4, MeanValue(GEWICHT)=0.00104655
parameter and GOALs for atomic position 1
--------------------------------------------
E=(CA+2(1.0000))
parameter and GOALs for atomic position 2
--------------------------------------------
E=(C(1.0000))
parameter and GOALs for atomic position 3
--------------------------------------------
E=(O-2(1.0000))

Local parameters and GOALs for phase Gypsum
******************************************************
XrayDensity=2.253
Rphase=12.57%
UNIT=NM
A=0.652441+-0.000092
B=1.52213+-0.00019
C=0.567678+-0.000075
BETA=118.4416+-0.0094
B1=0.00544+-0.00021
GEWICHT=SPHAR6, MeanValue(GEWICHT)=0.00642539
parameter and GOALs for atomic position 1
--------------------------------------------
E=(CA+2(1.0000))
parameter and GOALs for atomic position 2
--------------------------------------------
E=(S(1.0000))
parameter and GOALs for atomic position 3
--------------------------------------------
E=(O-2(1.0000))
parameter and GOALs for atomic position 4
--------------------------------------------
E=(O-2(1.0000))
parameter and GOALs for atomic position 5
--------------------------------------------
E=(O-2(1.0000))
All calculated parameters are provided with their 1σ estimated standard deviation (ESD). If the ESD of a parameter is in the same magnitude as its value one should have a critical look at the starting model:
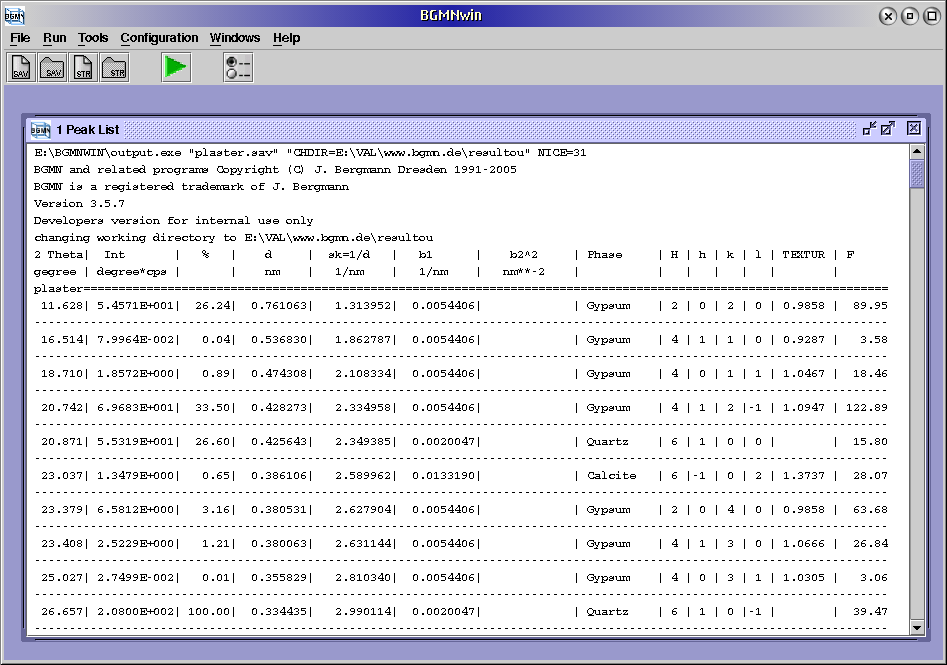
If you want to have a look at the peak list, you shouldn't read the
*.par file directly. Instead of this you can generate a
better readable peak list with the command:
Tools→Show Peak List
browse to the plaster.sav file, open it
and you will get a window displaying this information:
You may inspect the pattern as refined by selecting
Tools→Show Diagram
browse to your plaster.sav file and open it:
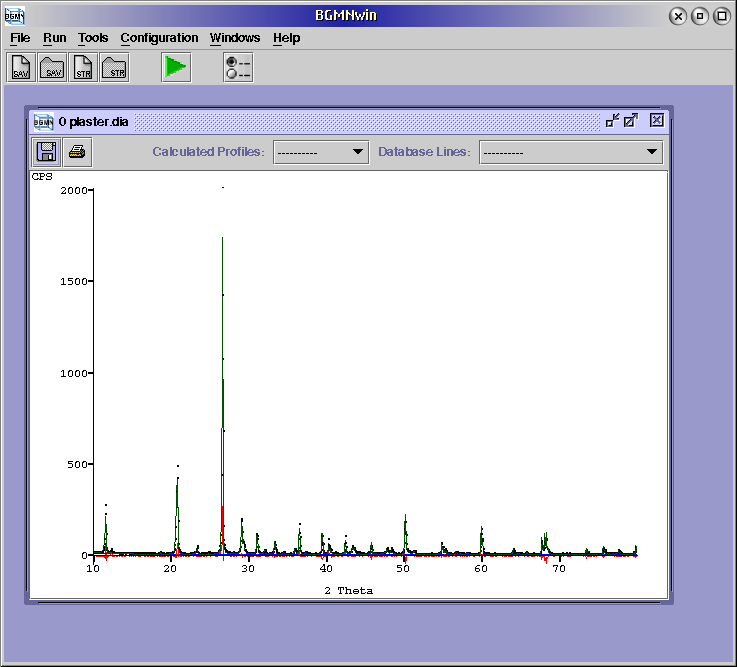
The relatively poor fit of the profile is the result of the used large
step width of 0.05°. But for routine use this is often sufficient.
You may zoom in and out using the left and right mouse button.
If no window opens: Probably, there is no DIAGRAMM=...
line in your plaster.sav file.